


Patient disposition
From November 2019 to July 2023, 428 participants were enrolled at eight centers in England and randomized to receive a control diet (n = 211; standard energy content, 2,000 kcal d−1) or intervention diet (n = 214; energy restriction, 1,200 kcal d−1 (Fig. 1 and Extended Data Fig. 1). Overall, the two groups were balanced with respect to baseline characteristics (Table 1). Characteristics of participants with missing data for maternal (n = 38) or neonatal (n = 45) primary endpoints were similar to those of the trial population overall (Extended Data Tables 1 and 2).
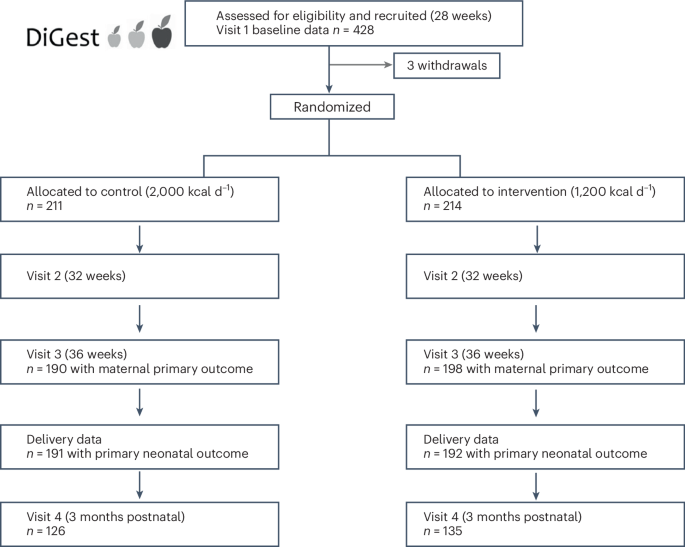
Participants were randomized to a trial arm after baseline measurements were complete and details of numbers achieved with maternal and neonatal primary outcomes.
During the trial, 59 participants withdrew from the study (29 (13.7%) from control group; 30 (14.0%) from intervention group). A further 53 patients stopped receiving the diet boxes before delivery but remained in the study (13.3% control group; 11.7% intervention group). This occurred typically after 36 weeks (after collection of maternal endpoint data) and the reasons included participants growing tired of the food in light of impending delivery (<1–2 weeks); pregnancy complications such as preeclampsia or threatened preterm delivery, especially if requiring hospitalization; hunger; concern about high glucose concentrations and stress (Extended Data Table 3).
Participants received the dietary intervention for a mean of 6.15 (s.d. 3.24) weeks in the control arm and 6.35 (3.29) weeks in the intervention arm (Extended Data Table 4). Allowing for the 10-day period of baseline data collection, the mean number of eligible weeks between enrollment and delivery was 8.95 (s.d. 1.80) in the control and 9.27 (1.85) in the intervention group (Extended Data Table 4), giving ordering rates of 68.9% in the control group and 68.8% in the intervention group. Satisfaction levels were consistent throughout the trial, with most participants being highly satisfied or satisfied with the quality of the food (85% control group; 81% intervention group; Supplementary Table 1).
Primary outcomes
There was no evidence of a difference in maternal weight change at 36 weeks, the primary maternal outcome, between groups (intervention +0.39 kg (4.23), control +0.54 kg (4.17); baseline-adjusted difference intervention versus control, β (adjusted effect size) −0.20 (95% confidence interval (CI) −1.02, 0.61); P = 0.623; Table 2). Results were unaffected when participants with preterm deliveries were included with adjustment for gestational age at delivery, when using multiple imputation (Extended Data Tables 5 and 6) and when the analysis was restricted to women who had ordered the diet boxes for 4 weeks or more (Extended Data Table 7).
No significant difference was observed in the primary neonatal outcome, standardized birth weight (Intergrowth), between the intervention and control groups (0.45 (1.04) versus 0.44 (0.91); β 0.005 (95% CI −0.19, 0.20); P = 0.962; Table 2).
Secondary outcomes
Provision of a reduced-energy diet reduced requirements for long-acting insulin therapy (39.2% control, 27.5% intervention; odds ratio (OR) 0.36 (95% CI 0.18–0.70); P = 0.003; number needed to treat (NNT) 8.5) at 36 weeks (Table 3). The effect of the intervention on long-acting insulin requirements was not affected by maternal BMI at enrollment, education, ethnicity, deprivation score, maternal age or study center (Fig. 2). There was no evidence of differences in requirements for metformin or short-acting prandial insulin, delivery modality, blood pressure or continuous glucose monitoring metrics at 36 weeks between trial arms (Table 3). Postnatal hemoglobin A1c (HbA1c) was significantly lower in the intervention group after adjustment for baseline HbA1c and the study center: median HbA1c (control group (n = 36) interquartile range (IQR)) 40.0 (36.5–42.0) mmol mol−1; intervention group (n = 27) 37.0 (37.0–40.0) mmol mol−1. In percentage: control group 5.8 (5.5–6.0)%; intervention group 5.5 (5.5–5.8)%; β −2.36 mmol mol−1 (95% CI −4.46, −0.26); P = 0.029; −0.22% (95% CI −0.41, −0.02); P = 0.029 (Table 3). Outcomes from the core outcome set for diabetes in pregnancy are provided (Table 3 and Supplementary Table 2). Maternal-health-related quality of life was stable throughout the study (Supplementary Table 3).
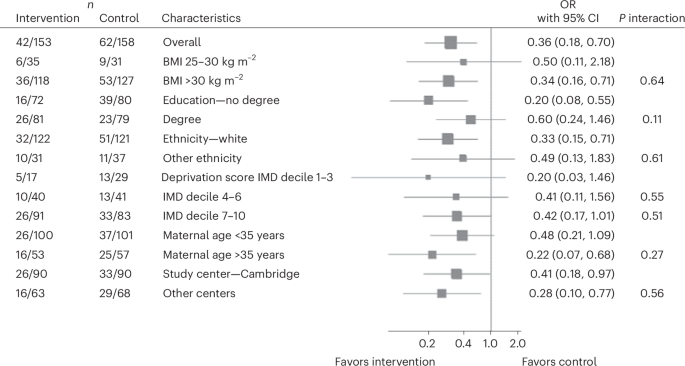
Post hoc subgroup analysis to determine the interaction effect of participant characteristics on the effectiveness of the intervention for the requirement of long-acting insulin. Subgroup analyses were conducted for maternal baseline BMI, education, ethnicity, socioeconomic status, maternal age and study center. Estimated effect sizes were calculated using unadjusted logistic regression and are shown as ORs for each subgroup with 95% CIs. Interaction P values (P interactions > 0.05 for all subgroups) indicate no statistically significant interaction with any subgroup. IMD, Index of Multiple Deprivation. n represents the number of participants with that characteristic out of the total number of participants in that trial arm that required long-acting insulin.
There was no evidence of a significant difference in large-for-gestational-age (LGA) rates, neonatal intensive care unit (NICU) admission, estimated gestation age at birth or cord blood C-peptide concentrations between trial arms (Table 3).
Safety outcomes
There were similar numbers of small-for-gestational-age (SGA) infants between trial arms, which fell within expected limits (Table 3). Rates of LGA, appropriate-for-gestational-age (AGA) and SGA infants were 18.4%, 77.9% and 3.7% for the control group and 20.3%, 74.5% and 5.2% for the intervention group respectively.
Exploratory outcomes
An exploratory analysis was performed to assess the effects of weight loss: data were treated as a cohort and categorized into two groups according to weight loss or weight gain during the study. The proportion of participants who lost weight was not statistically different between the intervention and control arm (Supplementary Table 4).
Women who lost weight (154 of 389; 39.6%) had a higher BMI at enrollment (37.05 kg m−2 (6.29) versus 34.58 kg m−2 (6.22); β 2.19 kg (95% CI 0.93, 3.50; P = 0.001) and were more likely to be taking metformin (OR 2.25 (95% CI 1.16, 4.38); P = 0.017) at 36 weeks (Table 4). Women who lost weight had a mean weight change of −3.01 kg (3.60) from enrollment to 36 weeks gestation compared to +2.75 kg (2.74) in women who gained weight (Table 4).
Weight loss was associated with significantly improved time in range (80.40% (15.76) versus 71.08% (19.27); β 6.53% (95% CI 2.06, 11.02); P = 0.004), continuous glucose monitoring (CGM) mean glucose (5.63 mmol l−1 (0.68) versus 5.94 mmol l−1 (0.86); β −0.22 mmol l−1 (95% CI −0.41, −0.02); P = 0.028); 101.46 mg dl−1 (12.16) versus 106.89 mg dl−1 (15.41); β −3.92 mg dl−1 (95% CI −7.41, −0.43); P = 0.028). Systolic blood pressure was also significantly reduced in women who lost weight (116.58 mmHg (12.61) compared to 119.34 mmHg (13.49); β −2.87 mmHg (95% CI −5.49, −0.25); P = 0.032) (Table 4).
Weight loss in late pregnancy was associated with reduced rates of LGA infants (OR 0.52 (95% CI 0.29, 0.93); P = 0.027; Table 4). Rates of LGA, AGA and SGA were 22.2%, 72.6% and 5.2% for the weight gain group and 15.4%, 81.9% and 2.7% for the weight loss group respectively. The number of SGA infants fell within expected limits in both groups. The effect of weight loss upon LGA appeared to be mediated through improved glycaemia at 36 weeks. When the model was adjusted for maternal time in range at 36 weeks, the association between LGA and weight loss was no longer significant (OR 0.90 (95% CI 0.41, 1.97); P = 0.787).
Weight loss in late pregnancy was maintained postnatally, associated with reduced weight (β −3.34 kg (95% CI −4.85, −1.82); P < 0.001) and BMI (β −1.25 kg m−2 (95% CI −1.80, −0.70); P < 0.001) at 3 months postpartum (Table 4). Weight loss in late pregnancy was associated with improved postnatal metabolic health including improved HbA1c (β −3.64 mmol mol−1 (95% CI −5.70, −1.57); P = 0.001; β −0.33% (−0.52, −0.14); P = 0.001).
The association between weight loss and CGM time in range (TIR) (3.5–6.7 mmol l−1), LGA and postnatal HbA1c was not affected by maternal BMI at enrollment, education, ethnicity, deprivation score, maternal age or study center (Extended Data Fig. 2).
Participants taking metformin at 36 weeks gestation were more likely to lose weight (OR 2.01 (1.19–3.40; P = 0.009 after adjustment for trial arm and study center). However, results of the weight loss analysis were consistent in magnitude and direction even after additional adjustment for metformin use. After adjustment for metformin use at 36 weeks gestation in addition to study center and trial arm, participants in the weight loss group had evidence of reduced infant LGA (OR 0.48 (95% CI 0.24, 0.95); P = 0.034), reduced maternal systolic blood pressure (β −3.00 mmHg (95% CI −5.75, −0.25); P = 0.033), reduced maternal mean CGM glucose (in mg dl−1: β −3.94 mg dl−1 (95% CI −7.63–−0.25); P = 0.037; in mmol l−1: β −0.22 mmol l−1 (95% CI −0.42, −0.01; P = 0.037), increased maternal TIR at 36 weeks (β 6.22% (95% CI 1.47, 10.97); P = 0.011) and reduced postnatal HbA1c (in mmol mol−1: β −3.78 mmol mol−1 (95% CI −6.54, −1.010; P = 0.009).
The timescales of changes in weight status, CGM TIR and average glucose, and postnatal HbA1c at each study timepoint between women who lost weight versus women who gained weight are shown in Extended Data Fig. 3.
Sensitivity analyses
Adjustments for gestational age at birth, multiple imputation and maternal dietary adherence did not alter the neonatal primary outcome (Extended Data Tables 5–7).
Post hoc analyses
As HbA1c at enrollment and postnatally was available only on a subset of participants due to COVID-19 restrictions, we assessed if this subset was representative of the larger cohort (Supplementary Table 5). Participants with an HbA1c at both timepoints were not statistically different to other participants in terms of maternal age, BMI, ethnicity, parity, baseline HbA1c (where available), oral glucose tolerance test (OGTT) results or baseline CGM metrics. However, they were more likely to have a degree (56% versus 46%), less likely to be a smoker (3% versus 12%), more likely to be diagnosed earlier (mean 20.5 versus 23.3 weeks) and more likely to be taking long-acting insulin at enrollment (40% versus 21%).
We compared groups that were categorized according to the presence of weight gain (>1 kg weight change), weight stability (±1 kg in weight change) and weight loss (>1 kg weight loss) from enrollment to 36 weeks gestation (Supplementary Table 6). Compared to the weight-stable group, weight loss was associated with improved glycaemia antenatally and postnatally, and a lower likelihood of LGA infants.
link
More Stories
Nutrition during pregnancy: Healthy recommendations
Addressing the gaps in nutritional care before and during pregnancy | Proceedings of the Nutrition Society
Sorry, expectant moms: ‘Eating for two’ isn’t really a thing